System Status Polling
Overview
The platform collects state from all servers and sites on demand and outputs all deviations from normal values as a result.
The absence of messages in the output is a criterion for successful self-diagnosis of the system. In some cases, informational messages may appear point-by-point: about CPU load increase, about rebooting of some microservice instance, about exceeding the message queue size, etc.
In general, the normal state is always accompanied by the absence of any warnings in the output. The administrator’s job is to keep the system in a normal state. The need for urgent intervention is decided by the administrator based on his knowledge of his instance of the system.
The system status is monitored in two ways.
Survey from the app
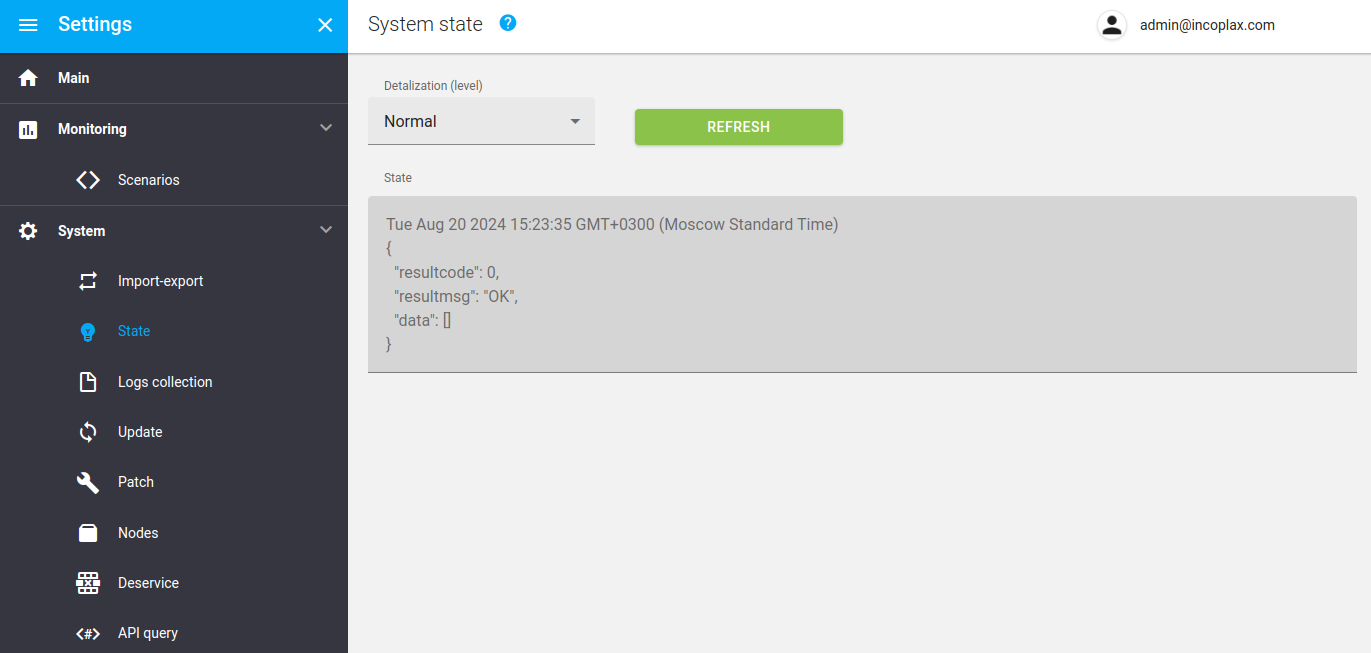
In the Settings application under the master domain administrator account. Select "System/Status".
Polling via API
GET /api/monitor/v1/system/state HTTP/1.1HTTP/1.1 200 OK
{
"resultcode": 0,
"resultmsg": "OK",
"data": {
"certificate": [
{
"site": "main_site",
"servers": [
{
"mdc1@192.168.0.126": [
{
"status": "error",
"reason": "Certificate expired",
"domain": "era-platform.ru"
},
{
"status": "error",
"reason": "Certificate expired",
"domain": "pbx.era-platform.ru"
}
]
}
]
}
],
"inactive_nodes": [
{
"site": "central",
"nodes": [
"ws3@192.168.0.127",
"mg31@192.168.0.127",
"mg32@192.168.0.127"
]
}
],
"cpu_usage": [
{
"site": "central",
"servers": [
{
"server": "192.168.0.125",
"busy_percent": 67.12,
"rup_load_avg1": 6.71,
"rup_load_avg5": 5.12,
"rup_load_avg15": 3.22,
"cpu_count": 4
}
]
}
]
}
}