10. Inspector panel
The map answers the question “what is what”, the panel answers the question “how exactly”.
This is where the administrator spends most of his time, so it’s worth sorting out
its device once and in detail.
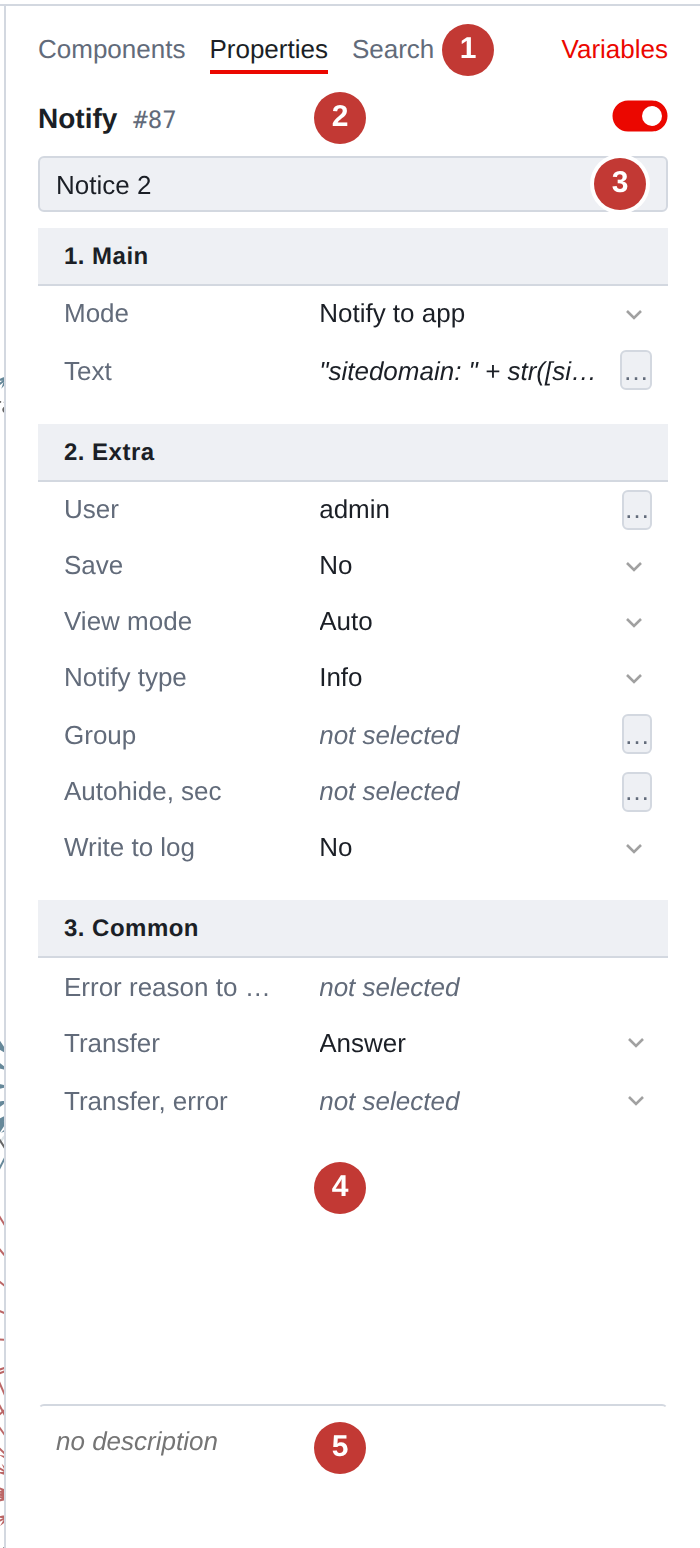
What is the panel made of?
-
Tabs. Components - palette, Properties - what
in the picture, _{tab-search}_ - search results. Tab _{tab-properties}_appears only when selected: without it, it has nothing to show. . *Title:* component type and number in the script. On the right is a toggle switch:
whether the component is turned on or off.
-
Name. The same thing that is visible on the map under the square.
-
Properties table. Names on the left, values on the right.
-
Description. Free text about this component - a note to yourself and for colleagues. Does not affect execution.
Property table
Each component type has its own set of properties and its own order in which
they are coming. Complex types have properties divided into semantic groups; simple types have
group one - “General”.
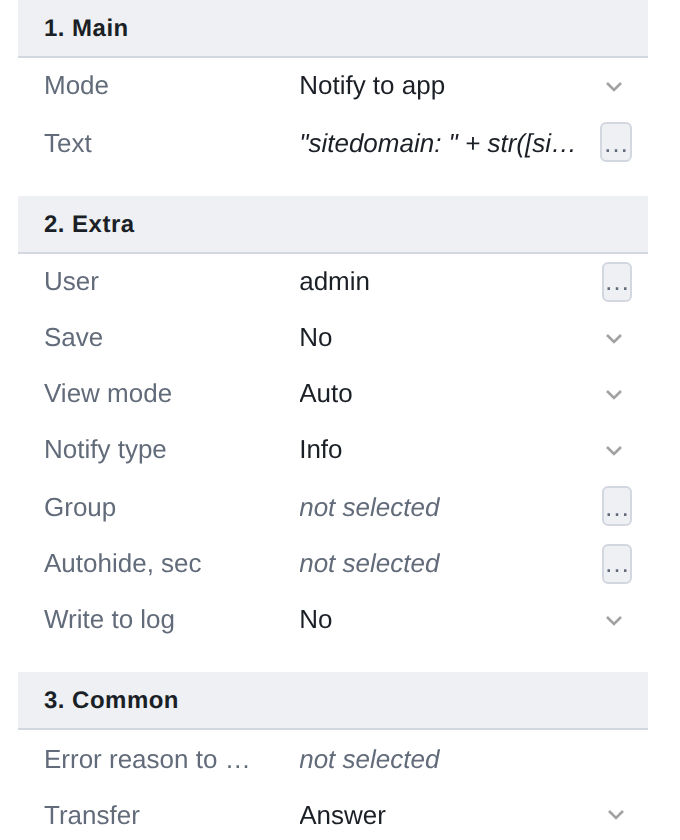
The names here are the same as in the component directory
(Script Components). If the name
does not fit and is cut off by an ellipsis, move the cursor: a tooltip will show it entirely, and the second line is the service key under which the property lies
in the script. The key will come in handy when you have to talk to support.
The border between columns can be moved: grab it with the mouse or
put focus on it with the Tab key and press ← and →.
The selected width is remembered.
Edit value
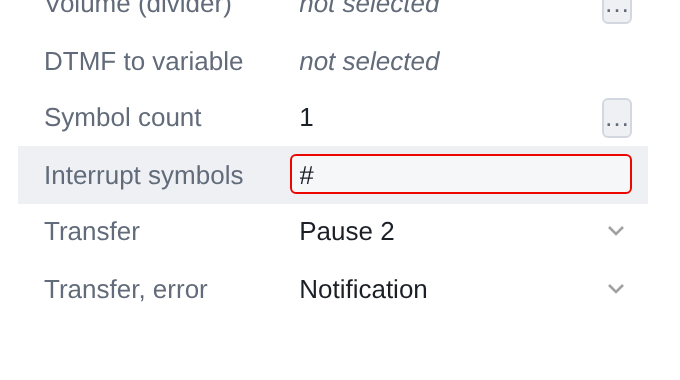
Clicking on a value starts editing. Then it depends on the field type: somewhere
an input field appears, somewhere a list opens, and somewhere a … button appears,
opening a separate window.
- Enter
-
apply the input.
- Esc
-
return what it was before editing.
- Tab
-
move to the next field, applying the entered one.
The edit is applied immediately—the cell does not have a separate “save” button. Everything you changed remains with you until you click Save
in a hat.
|
Consecutive edits to the same field are merged into one undo step. The typed word will not have to be canceled by letter: Ctrl+Z will remove it entirely. |
Button …
Three dots to the right of the value indicate that the field has its own window.
This is how all fields that are cramped into one line are edited: an argument with four
setting methods, table of menu branches, list of assignments, file selection.
If the dots are gray and do not respond to clicks, then this field does not have a window - The hover tooltip will say so.
Description
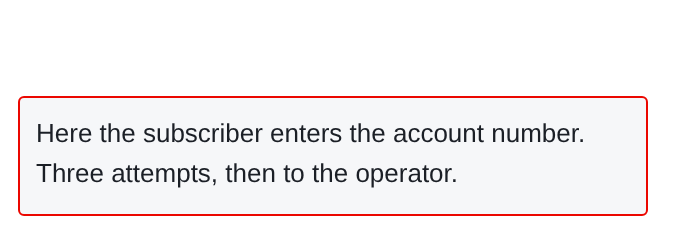
The area below the table is a description. This is plain text: why this component? here that he checks why it was done this way. On execution he
does not affect - it helps to recall important details of work
component. Help your future self where you need it.
The description is not a region: it is not shown on the map. But it hits
into the search, so you can find a component based on what is written in the description.
Editing the description ends with Ctrl+Enter or leaving the focus -
Enter breaks the line in it.
The height of the description can be changed: grab the separator above it. In the region
in place of the description is its own text - the one that is visible on the map.
Multiple components at once
If more than one component is selected, the panel shows the properties
common for all selected ones, and editing such a line changes the value immediately
the whole group. This is discussed in detail in
When type is unknown
The script may contain a type component that is not in the metadata −
for example, if it was started at another stand. This component will remain
on the map, the panel will honestly say that the type is unknown and the properties are not available,
and when saved, it will go to the server exactly as it came. Nothing
won’t get lost.
| ◀ 9. Large script | 11. Why did the field disappear ▶ |
|---|